Note
Click here to download the full example code
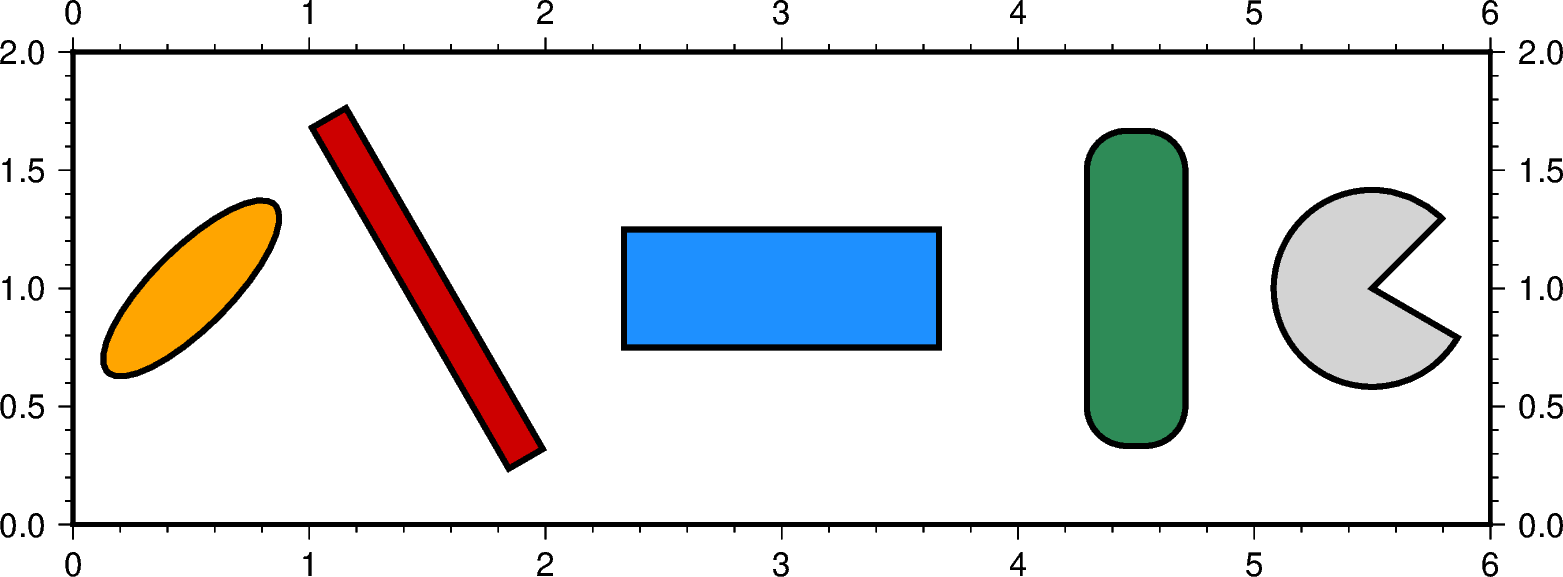
Multi-parameter symbols
The pygmt.Figure.plot method can plot individual multi-parameter symbols by passing
the corresponding shortcuts listed below to the style option. Additionally, we must define
the required parameters in a numpy array (or use an appropriately formatted input file) and pass it
to data.
The following symbols are available:
e: ellipses,
np.array([[lon, lat, direction, major_axis, minor_axis]])j: rotated rectangle,
np.array([[lon, lat, direction, width, height]])r: rectangle,
np.array([[lon, lat, width, height]])R: rounded rectangle,
np.array([[lon, lat, width, height, radius]])w: pie wedge,
np.array([[lon, lat, radius, startdir, stopdir]]), the last two arguments are directions given in degrees counter-clockwise from horizontal
Upper-case versions E, J, and W are similar to e, j and w but expect geographic azimuths and distances.
For more advanced options, see the full option list at https://docs.generic-mapping-tools.org/latest/plot.html.
Out:
<IPython.core.display.Image object>
import numpy as np
import pygmt

fig = pygmt.Figure()

fig.basemap(region=[0, 6, 0, 2], projection="x3c", frame=True)

###################
# ELLIPSE
data = np.array([[0.5, 1, 45, 3, 1]])

fig.plot(data = data,
         style = "e",
         color = "orange",
         pen = "2p,black")

###################
# ROTATED RECTANGLE
data = np.array([[1.5, 1, 120, 5, .5]])

fig.plot(data = data,
         style = "j",
         color = "red3",
         pen = "2p,black")

###################
# RECTANGLE
data = np.array([[3, 1, 4, 1.5]])

fig.plot(data = data,
         style = "r",
         color = "dodgerblue",
         pen = "2p,black")

###################
# ROUNDED RECTANGLE
data = np.array([[4.5, 1, 1.25, 4, .5]])

fig.plot(data = data,
         style = "R",
         color = "seagreen",
         pen = "2p,black")

###################
# PIE WEDGE
data = np.array([[5.5, 1, 2.5, 45, 330]])

fig.plot(data = data,
         style = "w",
         color = "lightgray",
         pen = "2p,black")

fig.show()
Total running time of the script: ( 0 minutes 0.471 seconds)