Note
Click here to download the full example code
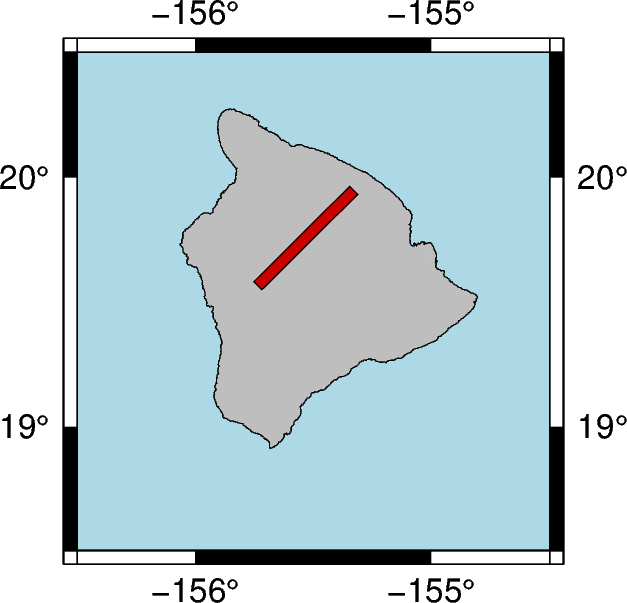
Rotated rectangle using azimuth
The pygmt.Figure.plot method can plot rotated rectangles based on a
given azimuth (in degrees east of north) as well as length and width. We can
define the required parameters in a numpy array or use an appropriately
formatted input file. Such representations are often used to e.g. display
results of shear-wave splitting analysis.

Out:
<IPython.core.display.Image object>
import numpy as np
import pygmt

fig = pygmt.Figure()

# generate a basemap around Big Island (Hawai'i) showing coastlines, land, and water
fig.coast(
    region=[-156.5, -154.5, 18.5, 20.5],
    projection="M6c",
    land="grey",
    water="lightblue",
    shorelines=True,
    resolution="f",
    frame=["x1", "y1"],
)

# store parameters for rotated rectangle in a numpy
# array (lon, lat, azimuth in degrees east of north, lenght, width)
data = np.array([[-155.533, 19.757, 45, 60, 5]])

# pass the data to the plotting function in addition to the corresponding
# style shortcut for rotated rectangles ("J") as well as set color and pen for
# the rectangle
fig.plot(data=data, style="J", color="red3", pen="black")

fig.show()
Total running time of the script: ( 0 minutes 0.394 seconds)